- number of previous marathons
- number of training days per week
- the mean distance run for each workout
- the longest run each week
- the mean workout distance per week
- the mean training pace
The training data he considered included 11 week, 10 week and 8 week average data leading up to one week before the race. Using the 8 week data he found the best correlations between performance time (marathon finishing time) came from mean training pace and mean distance per week (see Figure 1).
 |
| Figure 1. Data taken from Tanda (2011) showing the relationship between performance time for the 46 flat paced marathons and weekly distance in the preceding 8 weeks. |
The relationship between training pace and marathon performance was also rather scattered, but can be fitted with a straight line (see Figure 2).
 |
| Figure 2. Data take from Tanda (2011) showing the relationship between performance time for the 46 flat paced marathons and average training pace in the preceding 8 weeks. |
 |
| Figure 3. Data from Tanda (2011) showing the training space that the runners occupied over the 8 week period leading up to the marathon. |
This scatter in training space can be used to produce a predicted marathon performance by combining both pace and distance into one equation with the relevant relationships. For his dataset Tanda suggested the following equation (rearranged for race time and average speed):
Race time (min) = 12 + 98.5 * e(-km per week/189)+1390/average speed in km per hour
Figure 4 shows the predicted marathon time plotted against the actual marathon performance.
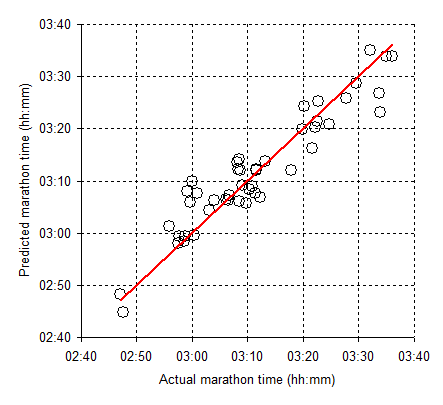 |
| Figure 4. Data taken from Tanda (2011) showing the predicted marathon time plotted against the actual marathon performance time. |
As I showed in the last post the equation is remarkably well behaved at the extremes. It predicts sensible values for someone who does no running and for an elite runner. But, to demonstrate I have plotted the data for a range of other runners (see next post).
Finally, it is possible to plot the marathon prediction times, as contour lines, on the training parameter space plot (Figure 5).
 |
| Figure 5. Tanda's dataset plotted in training parameter space (average 8 week training pace against average daily distance). Each data point has been coloured by marathon performance time (blue for the slowest then 'hotter' colours for the faster performances - red being the fastest). The thick colours lines are the contour lines from the prediction equation. The blue line shows the range of distance and paces that would predict a 3:30 marathon, green are the distance and paces for a 3:15 marathon etc. The thin coloured lines are the age-graded 90% effort lines for the four prediction lines. So, the thin blue lines shows a 90% daily age-graded effort for a 3:30 marathon runner. Note that most 3:00 runners (near the 3:00 thick line) are training at above 90% age-graded effort whereas the 2:45 runner(s) and the 3:30 are training (mostly) below 90% effort. Note that most of the parameter space (to the right of the thick line) contains no runners. |
The thick lines are the Tanda prediction contour lines for four different marathon finishing times. The thin lines show 90% age-graded effort for daily training for each of the marathon prediction times. Thus, the 2:45 runners are training below 90% effort - whilst the 3:00 runners are putting in over 90% effort each day. The 3:30 runners are also mostly training below 90% age-graded effort. The Tanda equation can be extrapolated out of the fitted parameter space. That is shown to the right of the thick straight line. No one in Tanda's dataset runs these types of averages. The big question is; "Why?". Is it that the equation fails in this space (i.e. is it impossible to complete a marathon in 2:45 by training at an average of 5 mins per km and 26 km per day for 8 weeks) or is it that no-one does that form of training? This question has some critical consequences. Tanda's dataset shows that marathon runners attempt to get faster by increasing their speed up to a 90% daily age-grade. At this point training is very hard. The 3:00 marathon runners are almost certainly unable to progress further using speed as a training tool.
Many thanks for all of this research, most interesting. I would just add that according to the literature the risk of injury increases with average training distance per week, but not with average training pace.[1] A glance at Figure 1 in Tanda (2011) suggests that, at the very least, it is probably worth running in excess of just over 60 km/week. However, the literature on injuries shows that the risk of injury increases significantly when running in excess of 64 km (40 miles) per week.[2][3] So not such a sweet spot after all, I guess there really is no free lunch in running.
ReplyDelete[1] http://dx.doi.org/10.1136/bjsm.2006.033548
[2] http://dx.doi.org/10.1001/archinte.1989.00390110113025
[3] http://dx.doi.org/10.1001/archinte.1989.00390110117026
Dear Martin, I agree that there is no 'free-lunch' in running - but, I am not sure papers like the Ontario study are conclusive that it is distance alone that causes injury. I suspect that the Ontario study contained very few runners doing high mileage but slowly - it simply isn't (or wasn't) a normal thing to do. I tend to agree that most club runners would get injured if they simply do more miles at their normal training speed (whatever normal means). There are always young people who do low mileages (perhaps a couple of runs a week) at high speed and survive perfectly well without injury. There will be almost no pensioners who just do high (absolute)-speed running a couple of times a week - largely because they will just get injured. Instead they tend to run a bit further and more slowly and get injured anyway...It is a self-selecting dataset where the regions (training spaces) with really high rates of injury are simply missing. We can certainly agree that whenever a person pushes their training to high levels the risk of injury increases. It is a matter of how fit one can get before that injury strikes. I know that for me - and a lot of other runners - fast training with low mileage produced low fitness gains before injury occurred whilst slower running with higher mileage allow for more fitness gains before injury occurred. Injury is the final endpoint for most people who race.
ReplyDelete